
For most endurance athletes, Zone 2 should carry the bulk of your weekly training, while Zone 3 gets used sparingly for tempo and race-specific efforts. The physiological logic comes down to your first ventilatory threshold (VT1): Zone 2 sits just below it, letting you accumulate volume with relatively low fatigue, while Zone 3 lies closer to or slightly above it, requiring more recovery time per minute. Confirm your own zones before trusting a percentage chart.
TL;DR:
- Most athletes should prioritize Zone 2 training at 80% of weekly volume to build aerobic capacity, reserving Zone 3 for specific race efforts.
- Individual variability in heart rate zones can reach up to 29%, making personal testing more reliable than relying on fixed percentage charts.
- Training in Zone 2 improves mitochondrial efficiency and fat oxidation, while Zone 3 boosts lactate tolerance and race-pace familiarity.
- Avoid the grey zone by slowing down more than feels comfortable on easy days and spacing out Zone 3 sessions to prevent overtraining.
- Use simple tests like the talk test and pace at heart rate to identify true zones, rather than solely trusting default device settings or age-based formulas.
Zone 2 feels conversational, allowing full sentences without gasping, generally corresponding to moderate intensity; Zone 3 feels more effortful, with talking reduced to short phrases and noticeably increased breathing.
That difference in feel maps onto real physiological gaps:
One thing worth flagging early: Harvard Health’s guide to heart rate zones points out that lower intensities rely more on fat as fuel, but for weight loss, total energy expenditure matters more than which zone you burned it in. Don’t chase “the fat-burning zone” at the expense of getting enough training done. The percentage ranges above are useful starting points, not laws. Your own numbers could sit five or ten beats either side, which is exactly why the next section matters.
The cleanest way to separate these zones isn’t a heart rate percentage. It’s VT1, the point where your breathing pattern shifts because carbon dioxide production starts outpacing what you can clear at a steady rate. Coaches and sport scientists increasingly recommend anchoring Zone 2 immediately below VT1 rather than relying on generic age-based charts, because VT1 reflects what your body is actually doing, not a formula guessing at it.
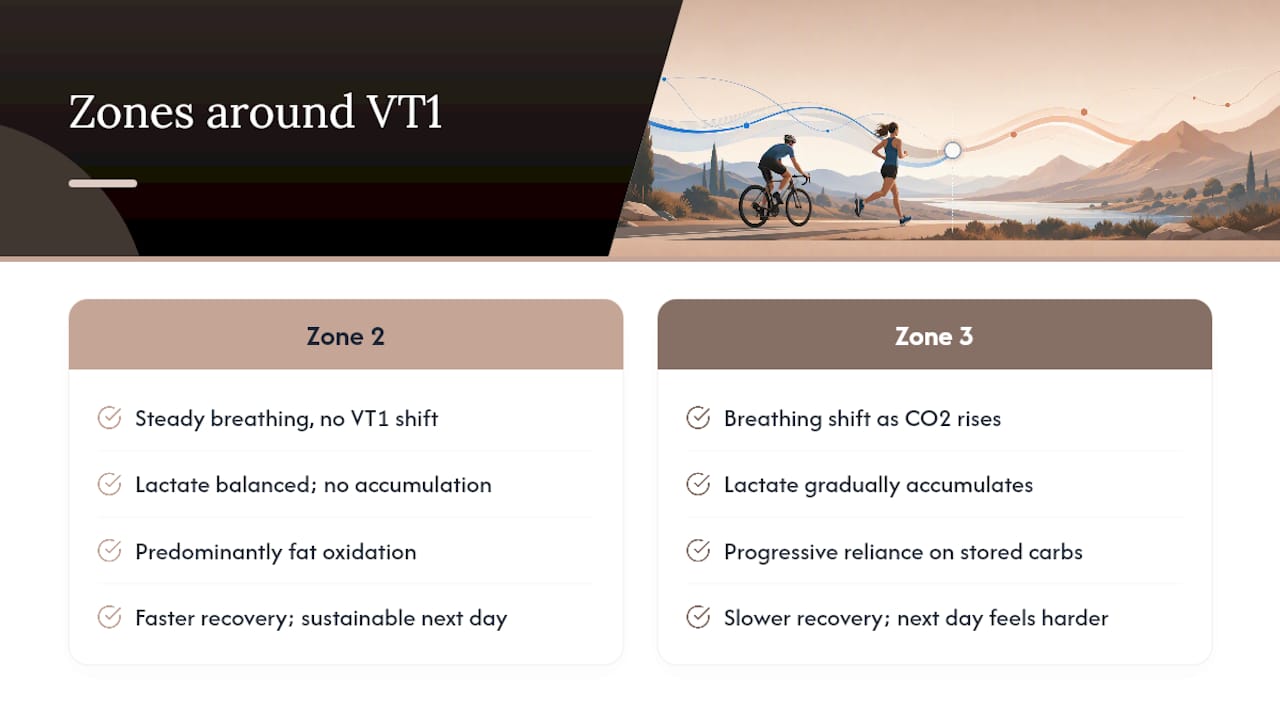
Below VT1, lactate production and clearance stay roughly balanced. Your muscles produce lactate constantly, even at rest, but at Zone 2 intensity your body clears it just as fast as it’s made. Push into Zone 3 and that balance starts to tip. Lactate accumulates gradually, not dramatically (that’s reserved for Zone 4 and above), but enough that recovery slows and the next day’s session feels harder than it should.
Fuel use shifts alongside this. Zone 2 relies predominantly on fat oxidation, which is precisely why sustained work at this intensity is thought to drive mitochondrial adaptations, the cellular machinery that lets you use oxygen more efficiently over time. Zone 3 draws progressively more on stored carbohydrate, which is finite and recovers more slowly than fat stores.
Individual variability in these markers is bigger than most training plans account for. A study tracking 50 cyclists found coefficients of variation between 6% and 29% for common Zone 2 markers, with fixed heart rate percentages performing far worse than VT1 or FatMax at predicting the true boundary.
That’s not a rounding error. It means two athletes with identical age and resting heart rate could have genuinely different Zone 2 ceilings, and a shared percentage chart will get at least one of them wrong. The research on individual variability in Zone 2 boundaries is a strong argument for testing yourself rather than trusting a table.
Zone 2 training develops aerobic capacity, mitochondrial efficiency, and fat oxidation, allowing higher training volumes with manageable fatigue.
Zone 3 training focuses on lactate tolerance and steady-state endurance at intensities closer to race pace, important for events run at faster speeds. Tempo runs, sustained time trials, and race-pace intervals all live here.
Pro Tip: If you only have three sessions a week, put two in Zone 2 and reserve the third for Zone 3 or above. That ratio protects recovery while still giving you race-specific stimulus.
Base-building phases should be dominated by Zone 2, following what’s often called the 80/20 principle: roughly 80% of weekly volume at low intensity, with the remaining 20% spent on harder work. Editorial guidance on Zone 2 training consistently backs high aerobic volume as the foundation endurance athletes need before anything else pays off.
Zone 3 earns its place once race specificity matters more than raw volume, or when training time is tight and you need more stimulus per minute. A polarised approach keeps deliberate time in Zone 3 low, saving planned tempo sessions for race-pace practice rather than scattering moderate effort throughout the week.
Three rules keep this balance workable:
Start with the simplest test you have: the talk test. If you can hold a full conversation, you’re in Zone 2. If you’re down to short sentences with noticeable breathing, you’ve crossed into Zone 3. This costs nothing and works surprisingly well as a first filter.
For something more precise without a lab, try this sequence:
Lab testing, where available, measures VT1 directly through breath-by-breath gas analysis, or estimates lactate thresholds through blood sampling during a graded test. It’s the gold standard for precision, but it’s not essential for most people, particularly given how much individual variability exists even among lab-tested athletes.
Watch out for device defaults. Most fitness watches still calculate zones from age-based formulas like 220 minus age, which can misclassify your true zones by ten to fifteen beats per minute. If your watch says Zone 2 but you’re breathless in two minutes, trust the talk test over the algorithm.
Pro Tip: Track your pace at a fixed heart rate over several months. If the same heart rate produces a faster pace over time, your aerobic base is genuinely improving, regardless of what zone label your watch assigns.
A 30 to 45 minute Zone 2 session needs no structure beyond holding steady effort throughout. Warm up gently for five minutes, settle into your calibrated Zone 2 pace, and finish with an easy cooldown. Longer Zone 2 sessions, an hour or more, benefit from a slight progression, starting a touch easier and drifting to the top of the zone as you warm through, with regular fuelling if you’re going past 90 minutes.
A Zone 3 tempo session of similar length looks different: 10 minutes easy, then 20 to 30 minutes at tempo effort, then a proper cooldown. Keep these shorter than your longest Zone 2 runs. The cost per minute is simply higher.
A simple two-week microcycle might look like this:
Notice Zone 3 never sits back-to-back with anything demanding. That spacing is what keeps this trade-off from tipping into overreaching.
The grey zone is what happens when “easy” runs drift into Zone 3 without you noticing. It’s the single most common way athletes stall progress while feeling like they’re working hard enough to deserve better results.
Age-based heart rate formulas are a major culprit here, alongside watches that default to them. Practitioner commentary on the grey zone points out that many runners believe they’re doing easy aerobic work when they’re actually training moderately hard nearly every session, a pattern that generates fatigue without the mitochondrial or top-end stimulus that either true Zone 2 or genuine high-intensity work provides.
The fix is almost always to slow down more than feels comfortable on easy days. If that correction doesn’t shift things within six to eight weeks, a coach assessment or a proper field test is worth the time.
Small-group personal training sessions can use talk-test cues and perceived effort alongside heart rate data to keep aerobic sessions genuinely aerobic, rather than drifting into the grey zone by accident. Coaches structure steady-state blocks to sit comfortably below the point where conversation gets difficult, then use separate, clearly labelled harder sessions when tempo or race-specific work is the goal.

Because sessions run in small groups rather than one-size-fits-all classes, individual pacing gets checked in real time, which is important given how much Zone 2 boundaries vary between people even at similar fitness levels. Recovery can be monitored between sessions too, helping to ensure a hard tempo day doesn’t quietly undermine the next scheduled effort. It’s calibration applied session by session, not just theory on a page.
Most training plans get this backwards. They chase tempo work because it feels productive, then wonder why race day performance stalls. The evidence points the other way: Zone 2 volume is what actually builds the aerobic engine, and Zone 3 only earns its place once that base exists.
The conventional advice to “just check your heart rate zone” undersells how unreliable fixed percentages are. A coefficient of variation stretching to 29% on common Zone 2 markers means two athletes with identical charts could be training in completely different physiological states. That’s the single biggest gap between popular guidance and what actually holds up.
If you take one thing from this, prioritise calibration over percentage charts. Use the talk test weekly, trust pace-at-heart-rate trends over months, and treat your watch’s default zones as a rough guess rather than gospel. Everything else, the session templates, the weekly ratios, the tempo work, only works once your zones are genuinely yours and not borrowed from a generic formula.
— Vitalij